Hi, I noticed that there are two ways of joining tables in query panel.
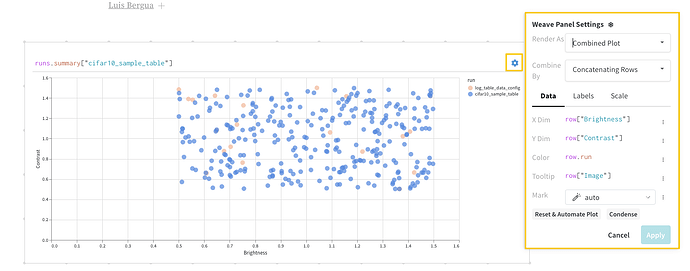
What are the differences in data structure between the concatenated tables obtained from these two methods? In my understanding, the first method can easily concatenate tables from different runs, but additional column names must be added to identify fields from different tables. If there are many tables to concatenate, the column names of the new tables will increase several times, right? This will be detrimental to subsequent filtering and other operations. The second method, except for the join column, transforms all other columns into a data type similar to a list, making the structure of the new table more concise and clear, without increasing column names, and allowing for comparison between different tables. However, when I try to convert it to combined plot, and represent different run data with different colors, I don’t know what to fill in the Color field. I tried using “row.run” (from the example you provided), but sometimes it doesn’t work.
What is the data type of ‘row’? Why is row.run effective in your example? How to distinguish data from different runs in my example?
BTW, I tried this first joining method, it didn’t work for me. Is there something wrong?
