Hi Olaf! Thanks for your answer! You have sent me a link to a report, so I can’t see what data has the graph, could you please send me a link to the chart or try to load the chart in the report again?
Hi Olaf! Thanks for the link! When I find this chart, it doesn’t seem to have any NaN values and is shown right, have you been able to solve the issue?
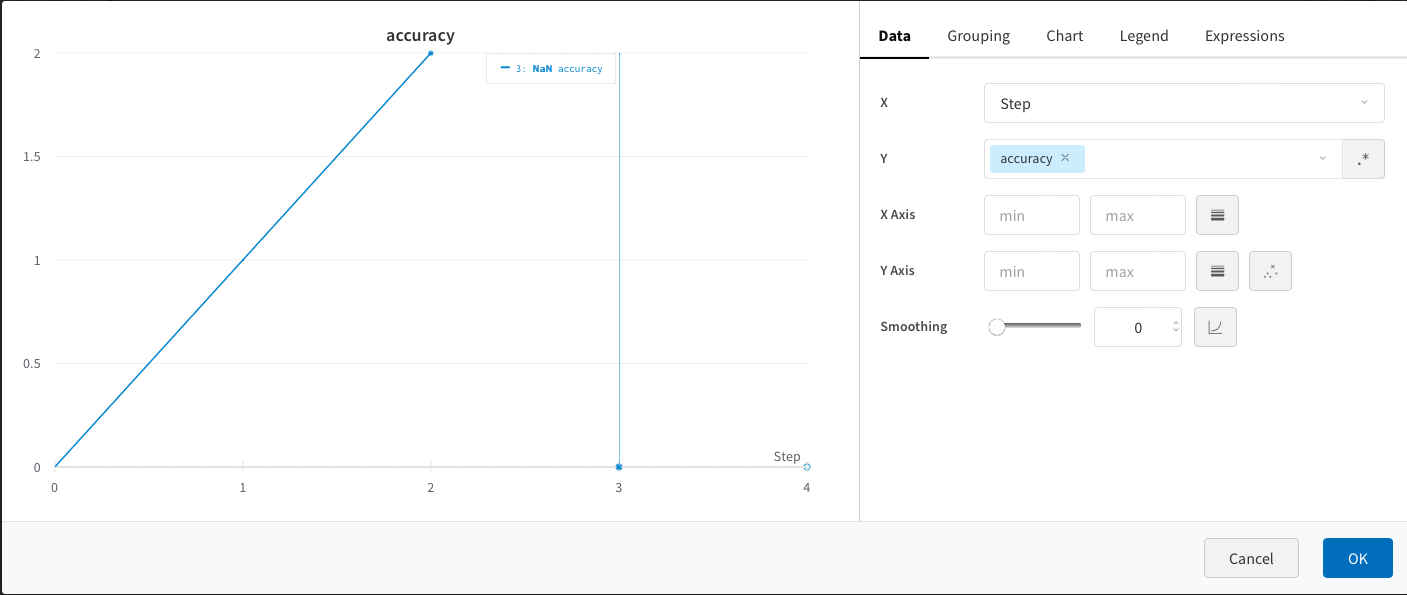
Hi Olaf! Thanks for clarifying, I’ve been able to find the chart that you mention. Could you please explain me what would be the right behaviour of the chart and what would you like to represent? From my understanding, it’s working properly. I you click in More actions → Export Panel → CSV Export, in the preview you can see that all the values are NaN. Also, as the Wall Time is a number and not a Series, wouldn’t it be useful to create a bar plot with Weave?
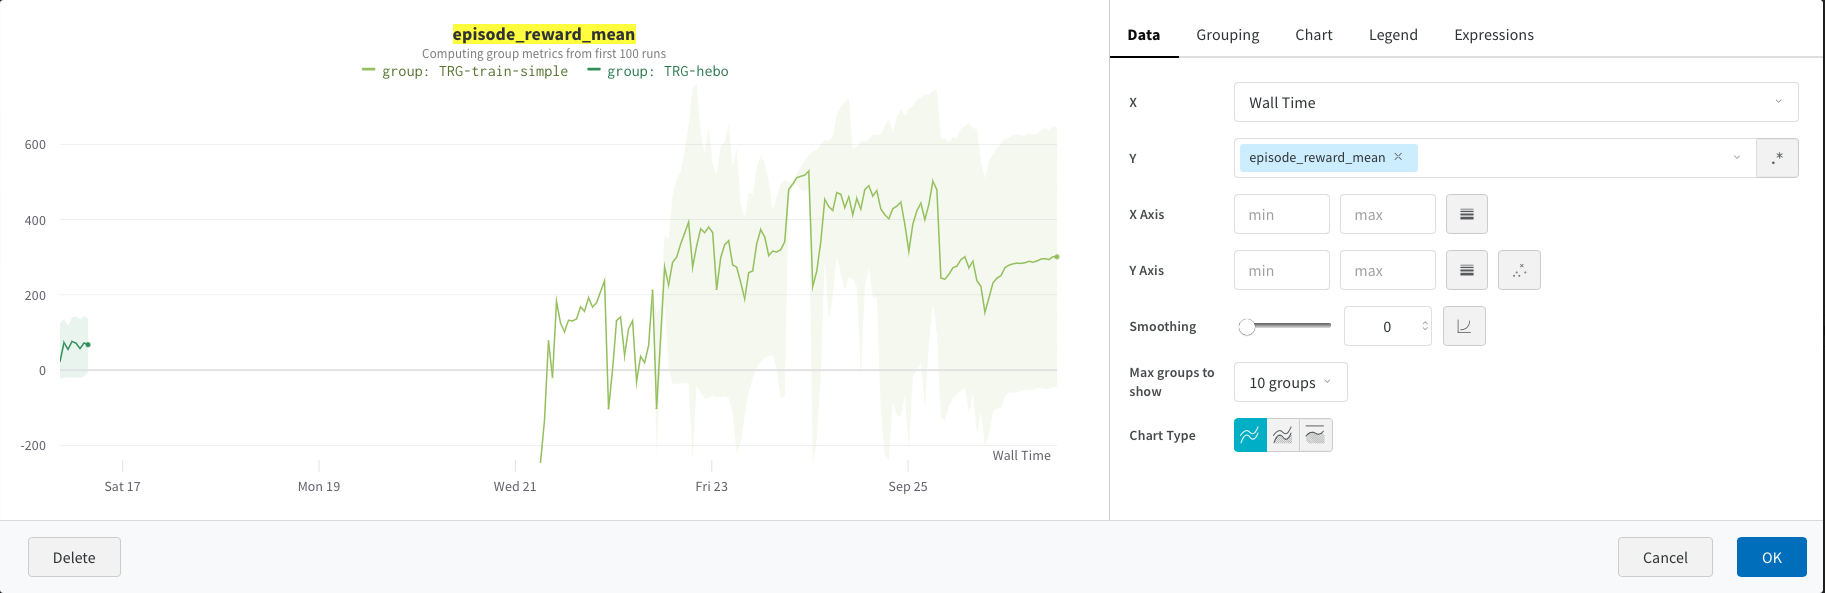
Ideally, the behaviour would be that the NaNs are ignored in the chart scaling, so instead of the previous behaviour (I can only post one image per post), I would see this, but with the Wall Time as X axis.
In terms of all values being NaNs - at least to me it looks like there is only a couple of NaNs per run, and then the runs continue fine. So that breaks the scaling, I think.
As for the bar plot - I’m not sure what I could do there. My aim is to plot the reward over run time.
I have just checked this issue and it seems that it is working properly now. I have set the X axis to Wall Time in the episode_reward_mean chart and it working right. Could you check if this is working properly also for you?
We wanted to follow up with you regarding your support request as we have not heard back from you. Please let us know if we can be of further assistance or if your issue has been resolved.
Since we have not heard back, I will go ahead and close this ticket for now. If you are having any issues again with this, feel free to message us here and we would be happy to re-open the ticket and keep investigating. Thank you!