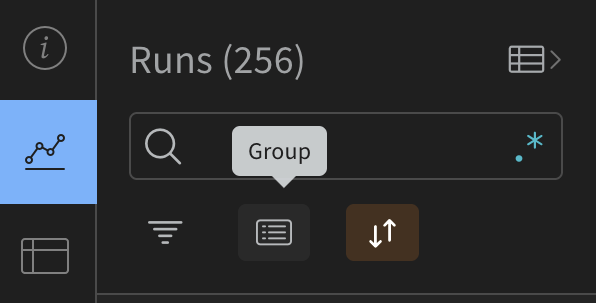
Hi @mateoballa thank you for writing in! In the Project level, you can group your Runs by all these three hyperparameters from the Group button as in the attachment.
Then the Charts will adjust to this grouping. Would this help, or you wanted something different to achieve? Could you share a screenshot of your current custom chart?