I have some variables in my sweeps that i want to be able to group by at the same time in my charts.
In this specific case it’s 3 hyperparameters of the architecture: “levels”, “convolutions per level” and “starting features”.
I can have multiple charts, grouping by one at a time, and see how each individual variable affects the runs, but it would be much more beneficial to see the effects of all three together.
The “custom chart” seemed the way to go, but i couldn’t make it work so far. Any help would be really appreciated!
Hi @mateoballa thank you for writing in! In the Project level, you can group your Runs by all these three hyperparameters from the Group button as in the attachment.
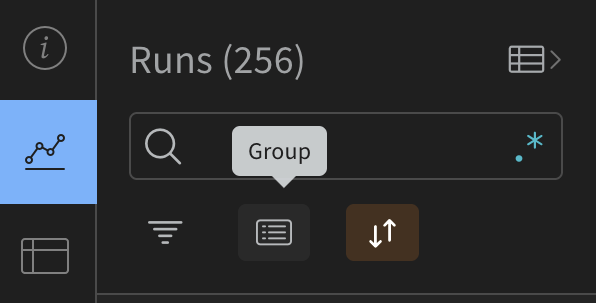
Then the Charts will adjust to this grouping. Would this help, or you wanted something different to achieve? Could you share a screenshot of your current custom chart?
Oh i never saw that option!
That’s perfect, thanks!
Glad to hear this works for you @mateoballa ! I am closing the ticket for now, but please feel free to ask if you have further questions, and we will be happy to reopen this and keep investigating!