Hello,
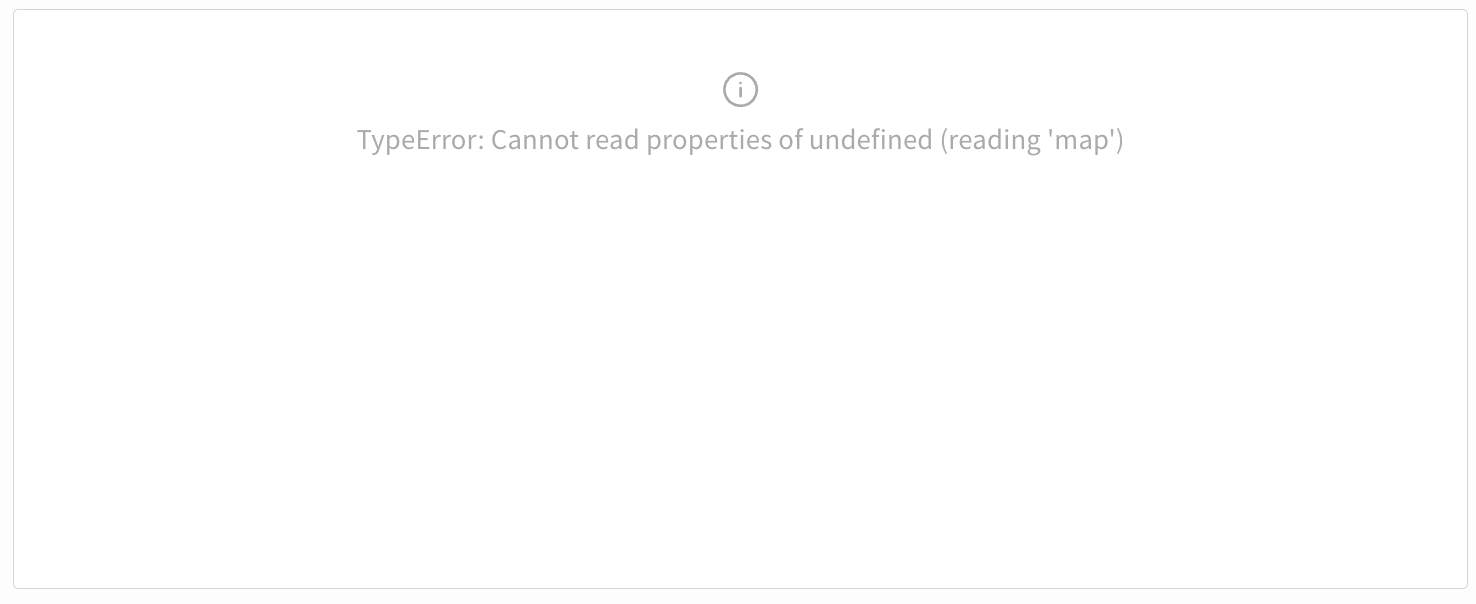
Has there recently been an update to how Vega-Lite charts are getting rendered? For some reason, I am now getting TypeError: Cannot read properties of undefined (reading 'map') for charts that as of last week rendered correctly. I haven’t touched the Vega-Lite code, and the data in the table I am using hasn’t changed either.
Error:
Sample data:
| Subject | Type | Metric | Value |
|---|---|---|---|
| SUB-001 | FP | 3 | |
| SUB-001 | TP | 12 | |
| SUB-001 | FN | 1 | |
| SUB-001 | Precision | 0.80 | |
| SUB-001 | Recall | 0.92 | |
| SUB-007 | FP | 4 | |
| SUB-007 | TP | 37 | |
| SUB-007 | FN | 3 | |
| SUB-007 | Precision | 0.90 | |
| SUB-007 | Recall | 0.93 |
Vega-lite code:
{
  "$schema": "https://vega.github.io/schema/vega-lite/v5.json",
  "description": "Diverging Chart with Properly Centered Labels, FN Offset, Borders, Dynamic Padding, and Legend Patch",
  "title": {"text": "${string:title}", "anchor": "middle"},
  "hconcat": [
    {
      "data": {"name": "wandb"},
      "transform": [
        {"filter": "datum['${field:metric}'] === 'Precision'"},
        {"calculate": "-datum['${field:value}']", "as": "NegValue"},
        {"calculate": "datum.NegValue / 2", "as": "HalfNegValue"},
        {"calculate": "format(datum['${field:value}'] * 100, '.1f')", "as": "FormattedPercent"}
      ],
      "layer": [
        {
          "mark": "bar",
          "encoding": {
            "y": {"field": "${field:label}", "type": "ordinal", "axis": {"title": "${field:label}", "labels": true}},
            "yOffset": {"field": "name"},
            "x": {
              "field": "NegValue",
              "type": "quantitative",
              "scale": {"domain": [-1, 0]},
              "axis": {"title": "Precision", "labelExpr": "abs(datum.value)"}
            },
            "color": {
              "field": "name",
              "type": "nominal",
              "scale": {"range": {"field": "color"}}
            },
            "opacity": {"value": 0.6},
            "tooltip": [
              {"field": "${field:label}"},
              {"field": "${field:metric}"},
              {"field": "${field:value}"},
              {"field": "name"}
            ]
          }
        },
        {
          "mark": {"type": "text", "align": "center", "baseline": "middle"},
          "encoding": {
            "y": {"field": "${field:label}", "type": "ordinal"},
            "yOffset": {"field": "name"},
            "x": {"field": "HalfNegValue", "type": "quantitative"},
            "text": {"field": "FormattedPercent", "type": "nominal"},
            "color": {"value": "black"}
          }
        }
      ],
      "width": 100
    },
    {
      "layer": [
        {
          "data": {"name": "wandb"},
          "transform": [
            {"filter": "datum['${field:type}'] === 'FP'"},
            {"calculate": "-datum['${field:value}']", "as": "NegValue"},
            {"calculate": "datum.NegValue / 2", "as": "HalfNegValue"},
            {"calculate": "datum['${field:value}'] + 1", "as": "LeftLimit"},
            {
              "calculate": "datum.LeftLimit <= 35 ? -1 * datum.LeftLimit - 20 : datum.HalfNegValue",
              "as": "DynamicX"
            }
          ],
          "layer": [
            {
              "mark": {"type": "bar", "stroke": "darkred", "strokeWidth": 1.5},
              "encoding": {
                "y": {"field": "${field:label}", "type": "ordinal", "axis": {"labels": false, "title": null, "ticks": false, "domainWidth": 0.01}},
                "yOffset": {"field": "name"},
                "x": {"field": "NegValue", "type": "quantitative"},
                "color": {
                  "field": "name",
                  "type": "nominal",
                  "scale": {"range": {"field": "color"}}
                },
                "opacity": {"value": 0.8},
                "tooltip": [
                  {"field": "${field:label}"},
                  {"field": "${field:type}"},
                  {"field": "${field:value}"},
                  {"field": "name"}
                ]
              }
            },
            {
              "mark": {"type": "text", "baseline": "middle"},
              "encoding": {
                "y": {"field": "${field:label}", "type": "ordinal"},
                "yOffset": {"field": "name"},
                "x": {"field": "DynamicX", "type": "quantitative"},
                "text": {"field": "${field:value}", "type": "quantitative"},
                "color": {"value": "darkred"}
              }
            },
            {
              "mark": {"type": "point", "size": 0, "tooltip": null},
              "encoding": {
                "x": {"field": "LeftLimit", "type": "quantitative"},
                "y": {"field": "${field:label}", "type": "ordinal"},
                "yOffset": {"field": "name"}
              }
            }
          ]
        },
        {
          "data": {"name": "wandb"},
          "transform": [
            {"filter": "datum['${field:type}'] === 'TP' || datum['${field:type}'] === 'FN'"},
            {"joinaggregate": [{"op": "max", "field": "${field:value}", "as": "TP"}], "groupby": ["${field:label}", "name"]},
            {"calculate": "datum['${field:value}'] / 2", "as": "HalfValue"},
            {"calculate": "datum['${field:type}'] === 'FN' ? datum.TP + datum.HalfValue : datum.HalfValue", "as": "CenteredValue"},
            {"calculate": "datum.TP + (datum['${field:type}'] === 'FN' ? datum['${field:value}'] : 0) + 1", "as": "RightLimit"},
            {
              "calculate": "datum['${field:type}'] === 'FN' && datum.RightLimit - datum.CenteredValue <= 30 ? datum.RightLimit + 20 : datum.CenteredValue",
              "as": "DynamicX"
            }
          ],
          "layer": [
            {
              "mark": {"type": "bar", "stroke": "black", "strokeWidth": {"expr": "datum['${field:type}'] === 'TP' ? 1.5 : 0.2"}},
              "encoding": {
                "y": {"field": "${field:label}", "type": "ordinal", "axis": {"labels": false, "title": null}},
                "yOffset": {"field": "name"},
                "x": {
                  "field": "${field:value}",
                  "type": "quantitative",
                  "axis": {"title": "Value", "labelExpr": "abs(datum.value)"}
                },
                "color": {
                  "field": "name",
                  "type": "nominal",
                  "scale": {"range": {"field": "color"}}
                },
                "opacity": {
                  "condition": {"test": "datum['${field:type}'] === 'TP'", "value": 0.8},
                  "value": 0.4
                },
                "tooltip": [
                  {"field": "${field:label}"},
                  {"field": "${field:type}"},
                  {"field": "${field:value}"},
                  {"field": "name"}
                ]
              }
            },
            {
              "mark": {"type": "text", "baseline": "middle"},
              "encoding": {
                "y": {"field": "${field:label}", "type": "ordinal"},
                "yOffset": {"field": "name"},
                "x": {"field": "DynamicX", "type": "quantitative"},
                "text": {"field": "${field:value}", "type": "quantitative"},
                "color": {"condition": {"test": "datum['${field:type}'] === 'TP'", "value": "black"},
                  "value": "red"}
              }
            },
            {
              "mark": {"type": "point", "size": 0, "tooltip": null},
              "encoding": {
                "x": {"field": "RightLimit", "type": "quantitative"},
                "y": {"field": "${field:label}", "type": "ordinal"},
                "yOffset": {"field": "name"}
              }
            },
            {
              "transform": [
                {"aggregate": [{"op": "max", "field": "RightLimit", "as": "MaxRightLimit"}]},
                {"calculate": "-1 * datum.MaxRightLimit + datum.MaxRightLimit", "as": "RedLineX"}
              ],
              "mark": {
                "type": "rule",
                "color": "black",
                "strokeWidth": 2
              },
              "encoding": {
                "x": {"field": "RedLineX", "type": "quantitative"}
              }
            }
          ]
        }
      ],
      "resolve": {"scale": {"x": "shared"}},
      "width": 400
    },
    {
      "data": {"name": "wandb"},
      "transform": [
        {"filter": "datum['${field:metric}'] === 'Recall'"},
        {"calculate": "datum['${field:value}'] / 2", "as": "HalfValue"},
        {"calculate": "format(datum['${field:value}'] * 100, '.1f')", "as": "FormattedPercent"}
      ],
      "layer": [
        {
          "mark": "bar",
          "encoding": {
            "y": {"field": "${field:label}", "type": "ordinal", "axis": {"labels": false, "title": null, "ticks": false}},
            "yOffset": {"field": "name"},
            "x": {
              "field": "${field:value}",
              "type": "quantitative",
              "scale": {"domain": [0, 1]},
              "axis": {"title": "Recall", "labelExpr": "abs(datum.value)"}
            },
            "color": {
              "field": "name",
              "type": "nominal",
              "scale": {"range": {"field": "color"}},
              "legend": {
                "title": null,
                "orient": "top"
              }
            },
            "opacity": {"value": 0.6},
            "tooltip": [
              {"field": "${field:label}"},
              {"field": "${field:metric}"},
              {"field": "${field:value}"},
              {"field": "name"}
            ]
          }
        },
        {
          "mark": {"type": "text", "align": "center", "baseline": "middle"},
          "encoding": {
            "y": {"field": "${field:label}", "type": "ordinal"},
            "yOffset": {"field": "name"},
            "x": {"field": "HalfValue", "type": "quantitative"},
            "text": {"field": "FormattedPercent", "type": "nominal"},
            "color": {"value": "black"}
          }
        }
      ],
      "width": 100
    }
  ],
  "resolve": {"axis": {"y": "shared"}},
  "spacing": -10
}