We are interested in using WandB to track monitoring statistics for a Model that is going into production. We have a process that runs known data against the model and records results to confirm operation and timing.
We would like to show the statistics in a lineplot over many iterations from these regular monitoring runs. Its important to be able see a plot tracking the values over time.
What is the recommended way to log run-to-run values?
Options:
- Use the
resume command to continue a RunID repeatedly for every monitoring run.
wand.init(project="name",id="my_run_id", resume=True)
This seems to work, but I have found that I can’t look at old values. Only the most recent values are shown under the Summary panel. It would be helpful to see a Table of all recorded values over time.
- Somehow use a Table, but can’t find a way to tack on data to a table from a previous run
- Use a separate Run for each test, but find some way to track statistics across runs. I’ve tried to search on this, but can’t find a way to do this across dozens to hundreds of runs.
Thanks for the help.
Hi @kevinashaw thank you for the question! These seem all valid options, and the decision depends on the specifics of your use case. Before diving into the implementation details, I wanted to confirm if this model is always the same, and the only change is the data that is fed into it? also could you please describe bit more the plotted data and what the x-axis would be, do the metrics change over time for each run, or each run provides a scalar and you want that value displayed on a different x-axis point?
Hi @thanos-wandb,
This is a production monitoring scenario where we are confirming operation of the model on a daily basis. The model does not change and the data does not change. We want to confirm that none of the underlying systems have drifted, failed or become misconfigured. Think of it in terms of Statistical Process Control (SPC) where machinery is monitored to confirm operation.
Plotting should show (hopefully) a dead flat line, since nothing will be changing for the predicted values, but the inferencing time should wander a bit in a narrow span.
Does this help?
The x-axis should be the iteration step or preferably the date, since the test will be run daily.
Thanks so much @kevinashaw for explaining the details of your use case, it’s really helpful. Production monitoring isn’t available now but is a roadmap item for us and currently in the design phase.
Regarding your issue though, there are couple workarounds to get this particular plot. Again here it seems you would be interested in the patch mode of artifacts which isn’t yet available. However, you could create a new artifact table version for each new datapoints you would want to add to it, and that could be easily plotted. For the resuming run option, the previous points should be in the history field, the summary is updated to the latest value. For both options, Weave could get the two fields (metric vs date) you want to plot. Would you be interested in a single line plot, or you want to overlay the band, error bars, etc?
Hi @kevinashaw just checking in to see if the above information helped, or if you would prefer to provide you with a minimal example in case it hasn’t been resolved for you.
Hi Thanos,
Thank you for checking in on this.
I have been using:
wandb.log({"ComputeTimeMean_msec":123.4},)
The suggestion to look into Weave is a good one. It seems very powerful and I was able to get it to plot.
Though I must say the documentation is vague and seems to cover only a fraction of the features that are available.
The concat operator, for example, seems to be critical but is not even mentioned in the docs. I only found it by trial-and-error.
Here is a Table I was able to generate using Weave:
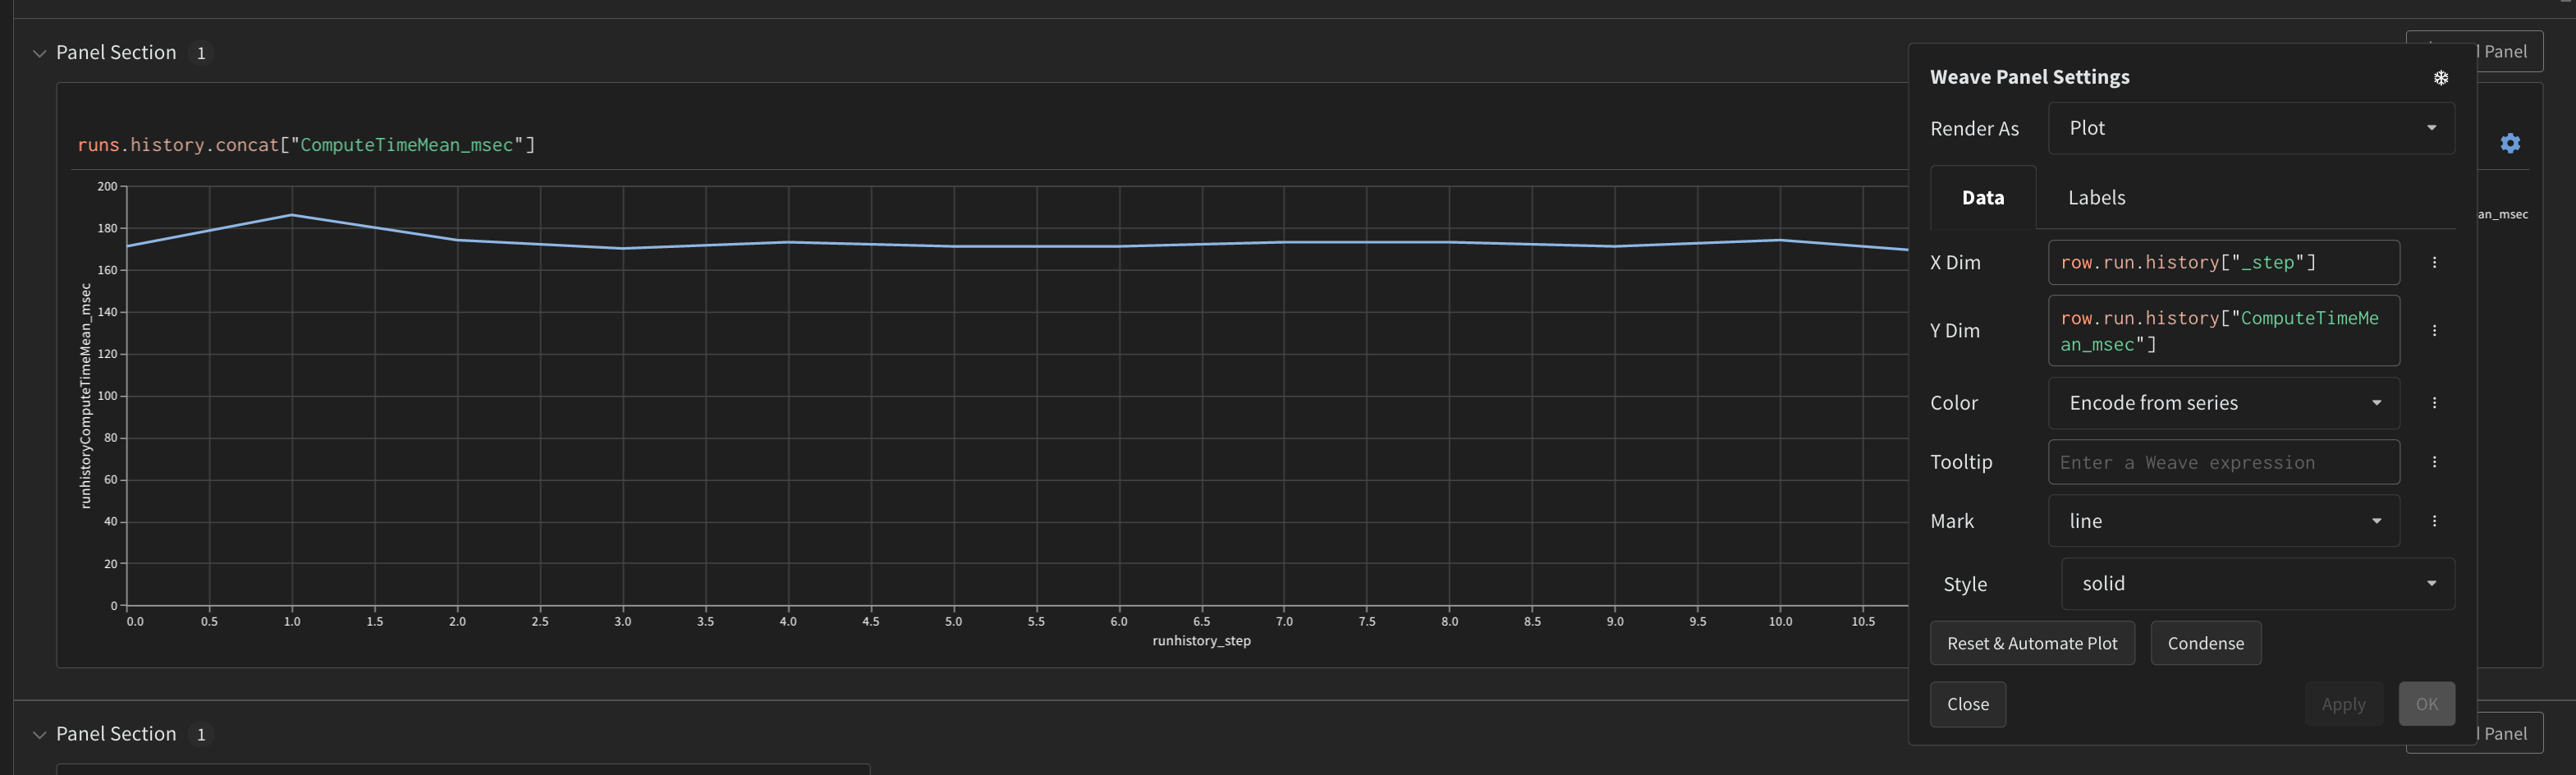
Here is a plot for the same data.
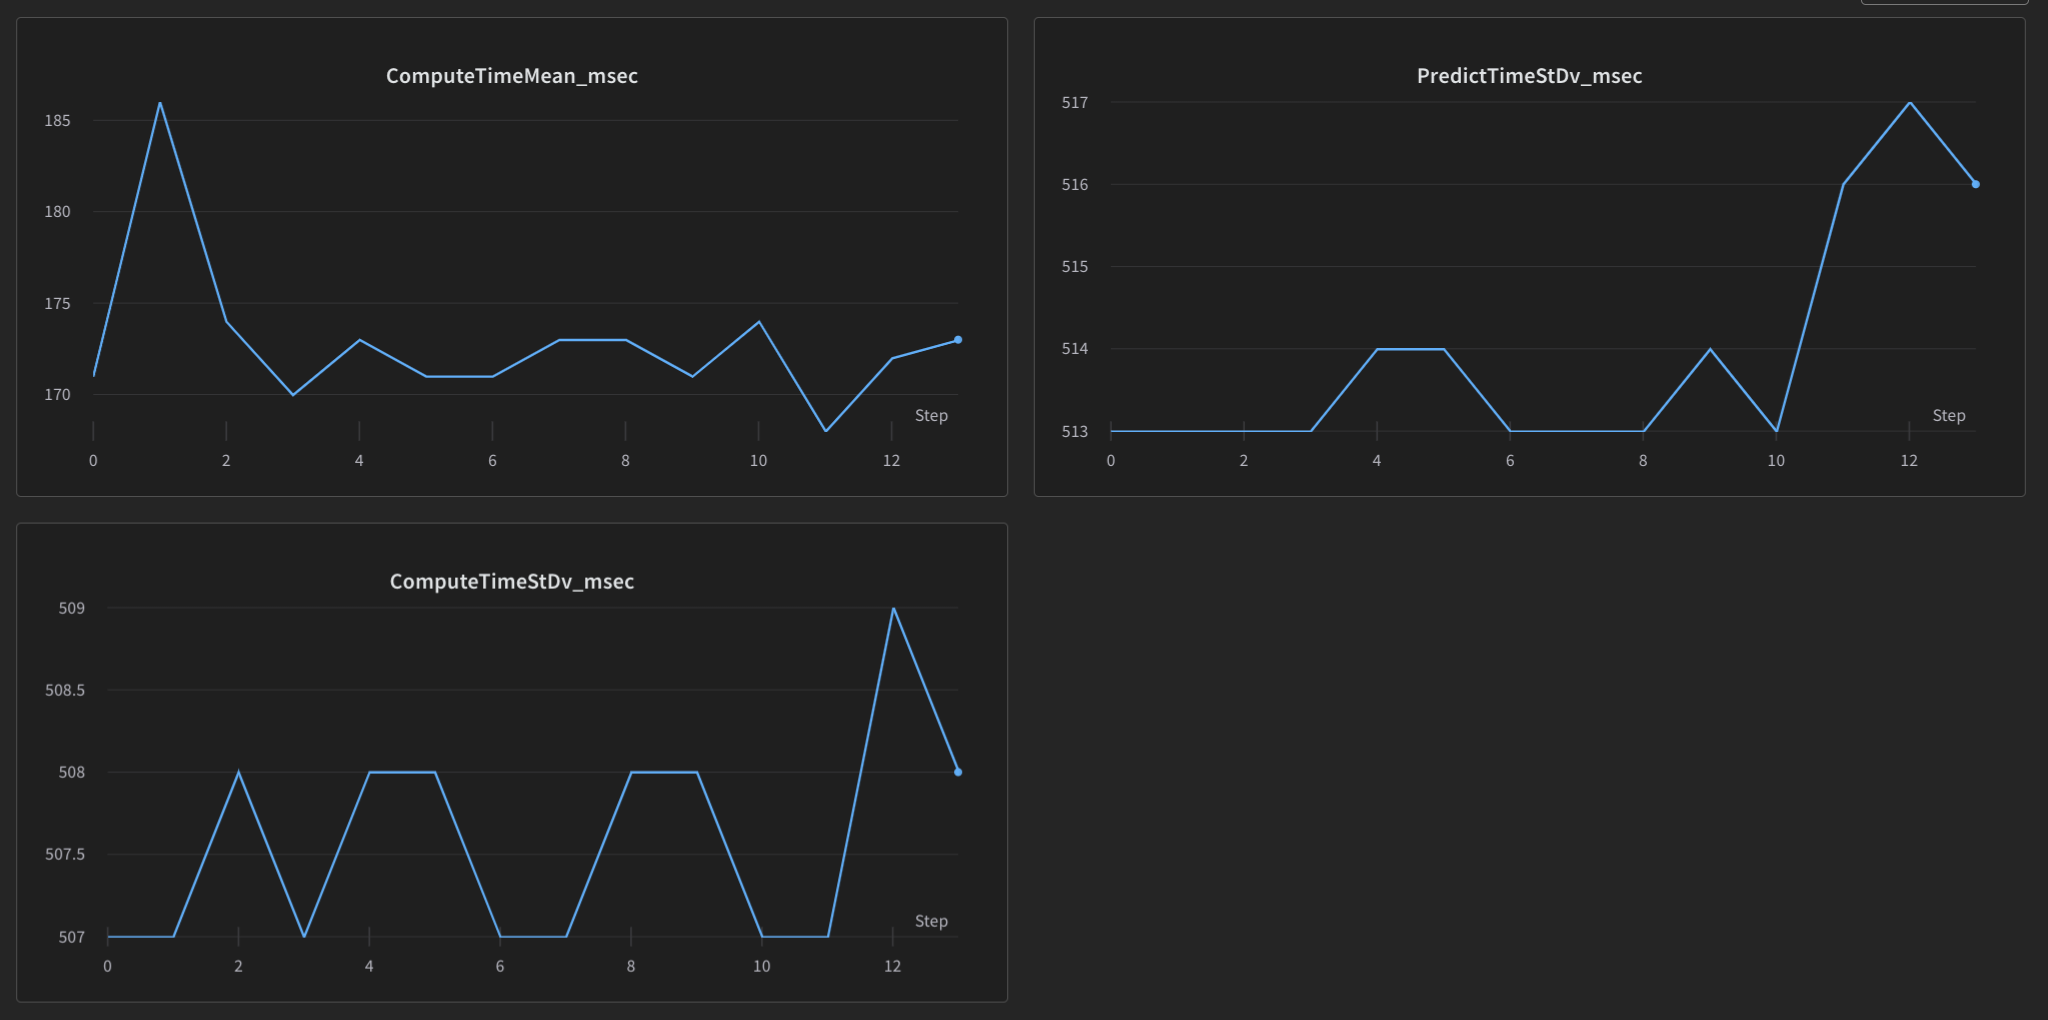
And here is the default chart that was automatically added. This almost seems easier to read, since the range-limits are auto-scaled – something that I was not able to do with Weave.
With regard to the original question, it seems that using wandb.log() along with weave should be sufficient for my needs. Is there anything else I should know about this?
Hi @kevinashaw great to hear you enjoy Weave and that it solves the original issue. Thanks so much as well for posting detailed information on how this was achieved for future reference here in the forum. Indeed the reference docs for Weave won’t cover all aspects yet, but Weave is actively developed with many new features coming in Q1 and the documentation is constantly updated. Would there be anything else to help with this issue?
Hi Thanos.
No, I think we are good on this.
Thank you!
Thanks @kevinashaw happy this is resolved for you, and thanks for posting the solution above. I am closing this ticket for now, and please let us know if you have any further questions that we can help you with.